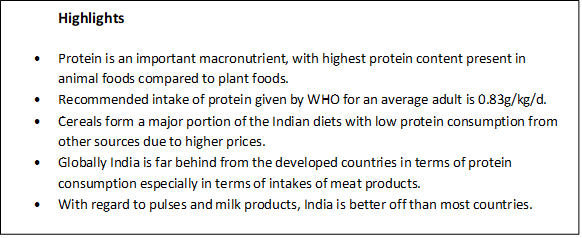
Are Indians Consuming Enough Protein?
July 13, 2022
Protein: Its importance and intake levels
Apart from Carbohydrates and fats, protein forms the third important macronutrient providing us with the nine essential amino acids required for our growth, with the highest protein content present in animal foods compared to plant foods. There are also various factors that come into play that determine the quantity and source of protein consumed. The major factor is the cost of protein foods- this justifies the consumption of plant protein sources by low-income families. Other factors are the local ecology or agricultural conditions due to regional differences affecting protein consumption and religious beliefs on meat consumption.
The joint WHO/FAO/UNU Expert Consultation (2007) recommended a 10% increase in the Estimated Average Requirement (EAR) for protein. For an average adult, the values of protein were declared to be 0·66g/kg/d and the safety requirement was 0·83g/kg/d.
Now the question arises, are we consuming enough protein daily to reach these levels?
India: Current Protein intakes
In India, cereals form the major source of energy which gives only about 10% of protein. However, in recent years the consumption of cereals has been declining due to the preference shifting to milk and milk products, beverages, fruits and nuts which is seen more prominently in the urban sector. This shift seems to be promising, but there is also a need to increase other sources of protein in diets such as pulses and meat products.
All India average protein intake
The recommended dietary intake of pulses is 40g as per the Indian Council of Medical Research (ICMR). In 2011-12, an increase was seen in the consumption of pulses in the rural sector (26.1g per day) and in the urban sector (30.03g per day). Leading this change were the states of Andhra Pradesh, Gujarat, Karnataka, Punjab, Maharashtra, Madhya Pradesh, Tamil Nadu and Uttar Pradesh.
Looking at the larger picture there is still a large proportion of both rural and urban populations that get their daily protein from cereal sources. The major reason is the increase in prices of eggs, fish, meat and milk products. (Table-1)
On comparing the total calorie intake from protein with the Eat Lancet sustainable diet (which recommends 29% of calories from Protein), India meets about only 6-8% of this requirement. With a calorie share of whole grains being significantly higher.
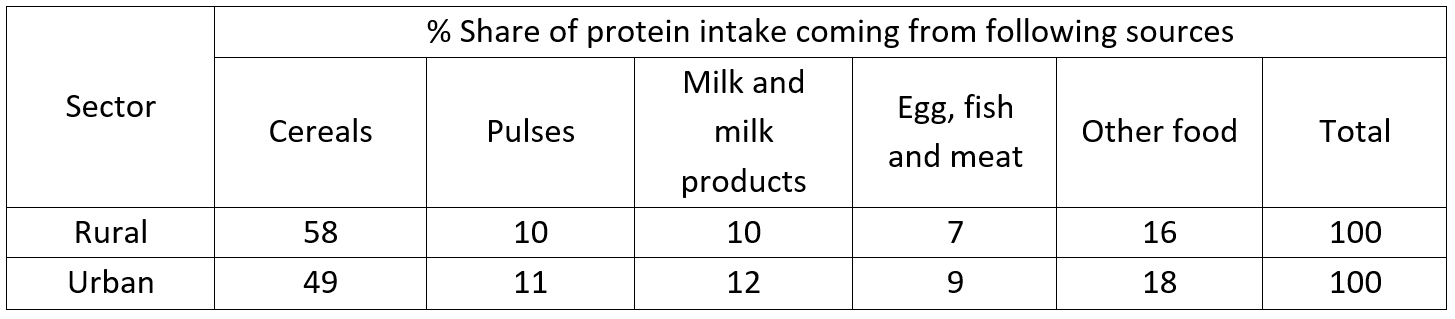
Table-1: The percentage share of protein intake from different food groups in Rural and Urban sectors (2011-12). Source: NSS Report No.560: Nutritional Intake in India, 2011-12
Global Protein Consumption vis a vis India
Global Figures
Overall protein consumption has risen to 80g of protein consumed per person per day in 2011. The total quantity of plant protein has also risen, however, its share in total intake has fallen. Looking at the last fifty years (1961-2011), the animal-based protein (ABP) consumption levels of developed countries have exceeded the minimum requirement8. This explains the data for the overall protein consumption level for developed countries to be higher than that of developing countries. (Figure-3)
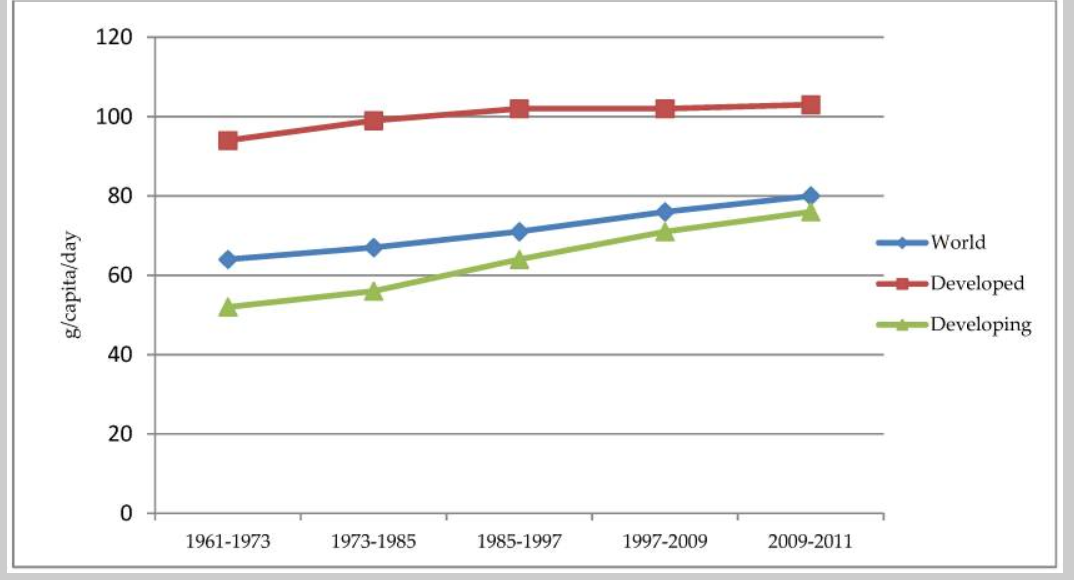
Figure-3: Global Protein consumption per capita from 1961-2011. Source: Analysis based on food balance and population data obtained from http://faostat3.fao.org.
Where does India stand?
The countries with the highest ABP intake are Spain, Argentina and Brazil consuming meat-based products. While India on the other hand shows the lowest ABP intake with Milk and milk product intake being the highest. (Table-2)
The global figure for the average consumption of pulses is 21 grams per capita per day. Latin America and the Caribbean, sub-Saharan Africa and South Asia (including India) have shown to consume the highest levels of average per capita pulses.
Globally as of 2018, the milk produced was 838Mt, with India being the largest producer of milk in the world. However, in terms of consumption of milk, Pakistan consumes the highest followed by European Union, the United States and India. Therefore, we can say that the milk protein intake of India is good enough compared to other countries.
Conclusion
With reference to the Eat Lancet diet, India’s share of calories from protein sources is very low6. Although only about 20-30% of the Indian population is vegetarian, the rest of the non-vegetarians consume meat occasionally. In fact, research proves that the share of calories from processed foods is higher than fruits. In comparison to the world protein intake level, India is far behind due to the lower consumption of ABP. The higher consumption of meat products by developed countries has now led to the issues of environmental sustainability, which has given way to the search for new sources of both plant and animal proteins.
References
1. Swaminathan, S., Vaz, M., & Kurpad, A. V. (2012). Protein intakes in India. British Journal of Nutrition, 108(S2), S50-S58. https://www.researchgate.net/profile/Sumathi_Swaminathan/publication/232737411_Protein_intakes_in_India/links/00b495226d27ae8b2c000000/Protein-intakes-in-India.pdf
2. Grigg, D. (1995). The pattern of world protein consumption. Geoforum, 26(1), 1-17. https://www.sciencedirect.com/science/article/abs/pii/0016718594000208
3. Rampal, P. (2018). An analysis of protein consumption in India through plant and animal sources. Food and nutrition bulletin, 39(4), 564-580. https://assets.publishing.service.gov.uk/media/5ae82173ed915d42f7c6bc6b/LANSA_Working_paper_24_Priya_Rampal.pdf
4. Ministry of Statistics and Programme Implementation & The World Food Programme, (2019). Food and Nutrition Security Analysis, India, 2019. http://www.indiaenvironmentportal.org.in/files/file/Food%20and%20Nutrition%20Security%20Analysis.pdf
5. NSS- 8th round, Ministry of Statistics and Programme Implementation, National Statistical Organization, (2014). Nutritional Intake in India, 2011-12. http://www.indiaenvironmentportal.org.in/files/file/nutritional%20intake%20in%20India%202011-12.pdf
6. Sharma, M., Kishore, A., Roy, D., & Joshi, K. (2020). A comparison of the Indian diet with the EAT-Lancet reference diet. BMC Public Health, 20, 1-13. https://link.springer.com/content/pdf/10.1186/s12889-020-08951-8.pdf
7. Sans, P., & Combris, P. (2015). World meat consumption patterns: An overview of the last fifty years (1961–2011). Meat science, 109, 106-111. https://oatao.univ-toulouse.fr/15552/7/Sans_15552.pdf
8. Henchion, M., Hayes, M., Mullen, A. M., Fenelon, M., & Tiwari, B. (2017). Future protein supply and demand: strategies and factors influencing a sustainable equilibrium. Foods, 6(7), 53.https://www.ncbi.nlm.nih.gov/pmc/articles/PMC5532560/
9. Rawal, V., Navarro, D.K. (2019). The Global of Economy Pulses. Food and Agricultural Organization of the United Nations, Rome. http://www.fao.org/3/i7108en/i7108en.pdf
10. OECD/FAO (2019), OECD-FAO Agricultural Outlook 2019-2028, OECD Publishing, Paris/Food and Agriculture Organization of the United Nations, Rome. Chapter 7. Dairy and dairy products. 180-182. http://www.fao.org/3/CA4076EN/CA4076EN_Chapter7_Dairy.pdf

Saayma Rizvi (BSc in Food Science and Nutrition)
Recent Articles